A 100-person company touring office space in Gurgaon gets quoted ₹95 per square foot for 10,000 sq ft in an older building versus ₹115 per square foot for similar space in a newer property.
The CFO does quick math: ₹9.5 lakhs monthly versus ₹11.5 lakhs. The cheaper option saves ₹2 lakhs per month, ₹24 lakhs annually.
Six months later, that same CFO is explaining to the board why actual occupancy costs are running ₹14 lakhs monthly—48% higher than the original ₹9.5 lakh rent.
Here’s what happened: The older building had inefficient HVAC (₹1.2 lakhs monthly in extra electricity), required ₹18 lakhs in immediate repairs (amortized to ₹50K monthly), lacked meeting rooms (forcing ₹40K monthly in coworking space rentals), and sat in a location adding 45 minutes to average employee commute (productivity impact worth ₹2.8 lakhs monthly based on salary costs).
The “expensive” building at ₹11.5 lakhs would have delivered lower total cost of occupation.
This pattern repeats constantly in Gurgaon’s office market. Companies optimize for base rent and get surprised by total occupancy costs.
What Total Cost of Occupation Actually Includes
TCO is every rupee you spend to occupy and operate office space, divided by number of employees, calculated monthly or annually.
Direct occupancy costs:
Base rent (the number in your lease)
Common Area Maintenance (CAM) charges
Utilities (electricity, water, internet)
Property tax and insurance
Parking charges
Security deposits (amortized over lease term)
Fit-out and setup costs:
Interior construction and furnishing
IT infrastructure and cabling
Signage and branding
Moving and relocation expenses
Regulatory compliance (fire safety, permissions)
All amortized over lease tenure
Operating and maintenance costs:
Repairs and reactive maintenance
Cleaning and housekeeping
Consumables (pantry supplies, toiletries)
Equipment maintenance (ACs, elevators, plumbing)
Pest control and sanitation
Building management fees
Productivity and people costs:
Commute time (valued at salary cost per hour)
Downtime from facilities issues
Meeting room shortages forcing external bookings
Recruitment and retention impact
Health costs (poor air quality, ergonomics)
Hidden costs that don’t show up in budgets:
Management time spent on facilities issues
Opportunity cost of space that doesn’t support business
Client perception impact (affects sales, not real estate line item)
Employee morale and engagement (affects retention, not occupancy costs)
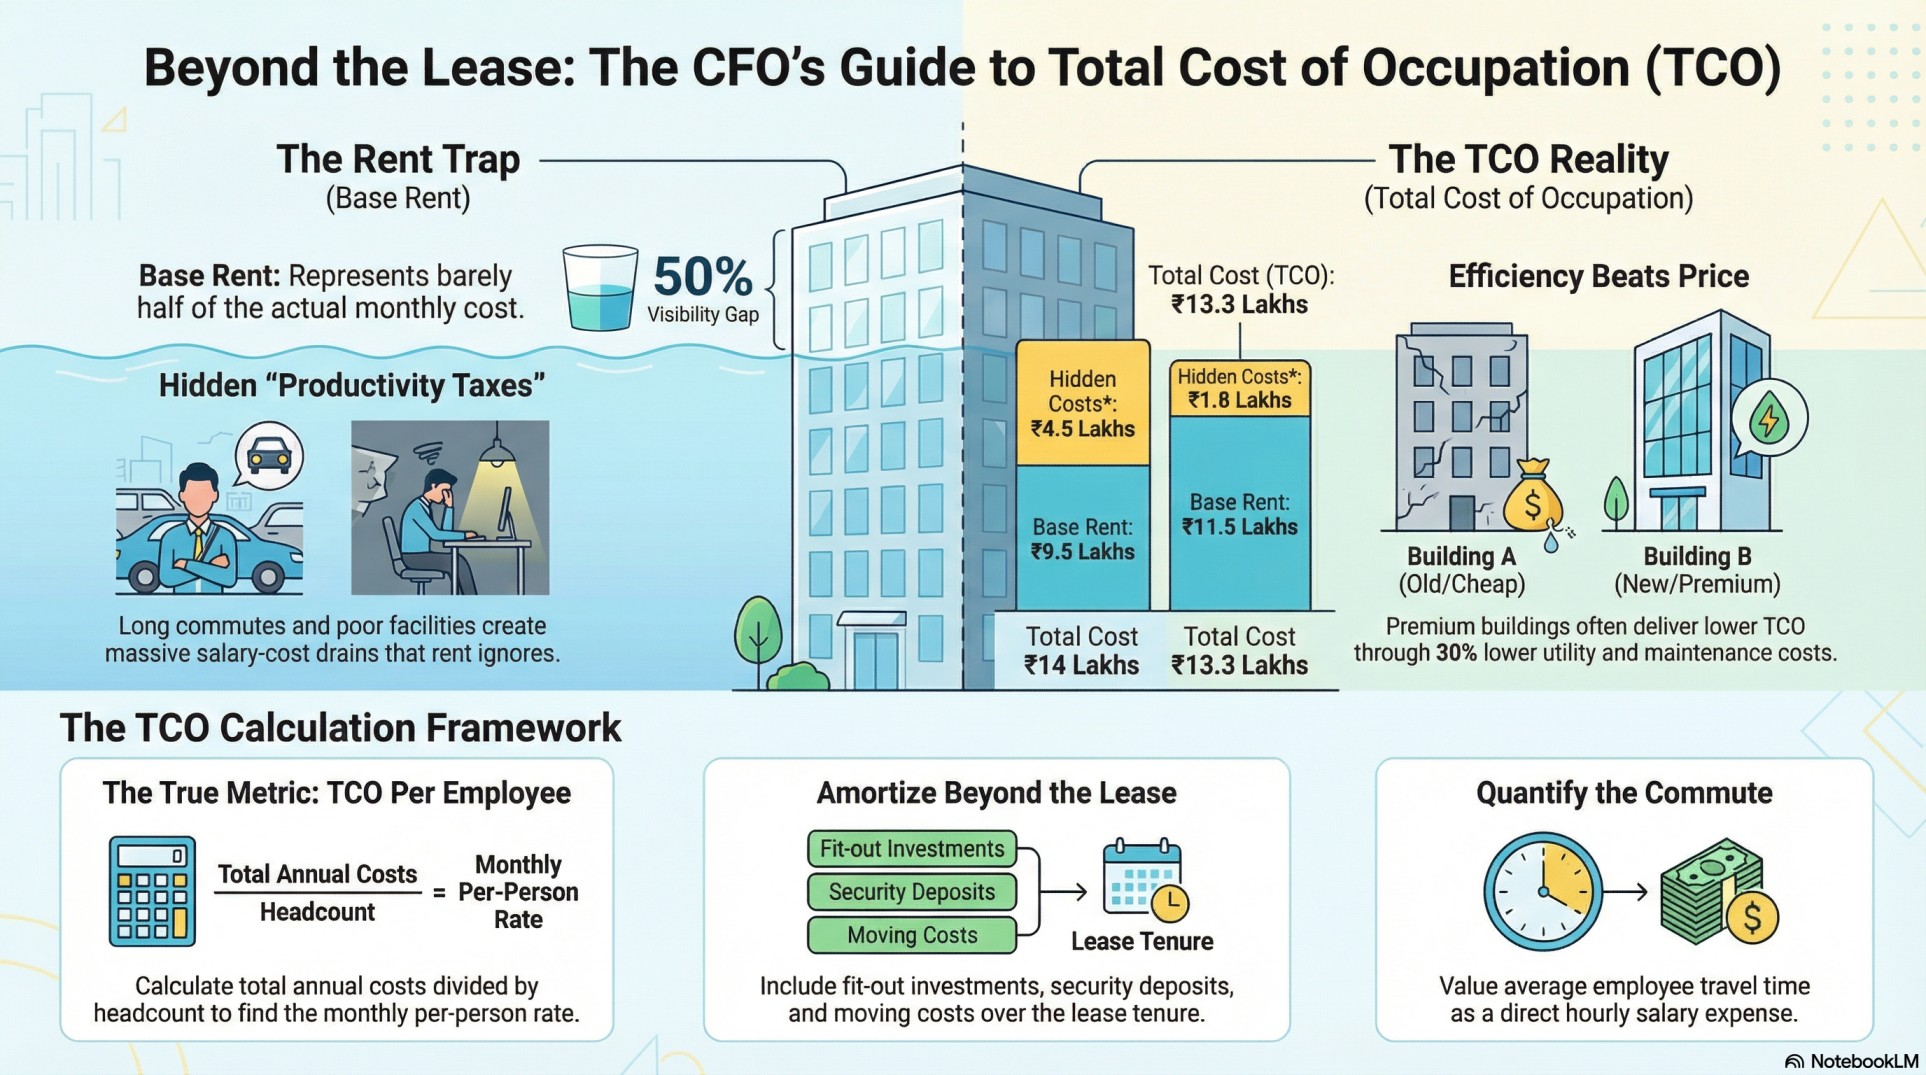
For a typical 100-person company in Gurgaon, base rent might be ₹10 lakhs monthly. Total occupancy cost often runs ₹18-22 lakhs monthly when you include everything.
Base rent is 45-55% of actual cost. The other 45-55% gets buried in different budget lines, making it invisible in real estate decisions—but very visible in company finances.
Why TCO Matters More Than Ever in 2026
Three shifts are forcing CFOs to think beyond base rent.
Hybrid work changed utilization patterns. Pre-COVID, you paid for space and knew it was occupied Monday-Friday. In 2026, office utilization runs 60-75% on average. You’re paying for empty desks 25-40% of the time.
That makes every other cost more important. If rent is ₹100K per seat annually but only 65% utilized, effective cost is ₹154K per seat actually using the space. Now those ₹20K annual utility costs per seat matter a lot more—they don’t scale down with lower utilization.
Buildings vary dramatically in operating costs. Two buildings at similar rents can have 40-60% difference in utilities, maintenance, and operational costs. Older buildings, buildings with inefficient systems, buildings in poor condition—they cost more to operate even if rent is lower.
AIHP sees this in tenant conversations constantly. A company moves from an older building to managed office space expecting higher rent to mean higher total cost. Then discovers total monthly cost is similar or lower because utilities, maintenance, and operational overhead dropped.
Financial scrutiny on real estate intensified. When office was 100% occupied and clearly necessary, CFOs approved decisions with less analysis. In a hybrid world where office role is being questioned, every real estate decision gets finance scrutiny.
“Why are we paying ₹X for this space?” becomes a quarterly board question. You need better answers than “that’s the market rate.” You need to show total cost is optimized for value delivered.
The TCO Calculation Framework
Here’s how to actually calculate TCO for your Gurgaon office evaluation:
Step 1: Calculate annual direct costs
Rent: Monthly rate × 12 months
CAM: Monthly charge × 12 months
Utilities: Average monthly (get estimates from landlord) × 12 months
Parking: Rate per slot × slots needed × 12 months
Property tax/insurance: Annual amount
Step 2: Amortize upfront costs
Fit-out investment ÷ lease tenure (years)
Security deposit × (opportunity cost rate ÷ lease tenure)
Moving costs ÷ lease tenure
IT infrastructure setup ÷ expected useful life
Step 3: Add annual operating costs
Maintenance contract: Annual amount
Cleaning/housekeeping: Monthly cost × 12
Consumables: Monthly average × 12
Equipment servicing: Annual contracts
Management overhead: Estimate staff time spent on facilities
Step 4: Factor productivity costs
Average commute time increase/decrease × hourly salary cost × 220 working days × headcount
Downtime from facilities issues (estimate hours lost annually × salary cost)
Meeting room shortage impact (external coworking usage, productivity lost to scheduling conflicts)
Step 5: Divide by employee count
Total annual TCO ÷ planned headcount = TCO per employee annually
Divide by 12 for monthly TCO per employee
Compare options on this basis, not base rent
Example calculation:
Building A (lower rent):
Rent: ₹95/sq ft × 10,000 sq ft = ₹9.5L monthly = ₹114L annually
CAM: ₹15/sq ft × 10,000 = ₹1.5L monthly = ₹18L annually
Utilities: ₹1.2L monthly = ₹14.4L annually
Fit-out (amortized over 5 years): ₹50L ÷ 5 = ₹10L annually
Maintenance: ₹6L annually
Commute impact (45 min extra, 100 employees, ₹50K avg salary): ₹2.8L monthly = ₹33.6L annually
Total: ₹196L annually ÷ 100 employees = ₹1.96L per employee per year = ₹16.3K per employee per month
Building B (higher rent):
Rent: ₹115/sq ft × 10,000 sq ft = ₹11.5L monthly = ₹138L annually
CAM: ₹12/sq ft × 10,000 = ₹1.2L monthly = ₹14.4L annually
Utilities: ₹70K monthly = ₹8.4L annually
Fit-out (amortized over 5 years): ₹30L ÷ 5 = ₹6L annually
Maintenance: ₹3L annually
Commute impact (15 min less, 100 employees): -₹0.9L monthly = -₹10.8L annually
Total: ₹159L annually ÷ 100 employees = ₹1.59L per employee per year = ₹13.3K per employee per month
Building B costs ₹2L more in monthly rent but ₹3L less in monthly total cost. That’s ₹36 lakhs annual savings versus choosing the “cheaper” option.
Where Companies Get TCO Analysis Wrong
Even when companies attempt TCO calculations, three mistakes trip them up.
They ignore productivity costs. Commute time, facilities downtime, meeting room shortages—these have real salary costs attached. A 30-minute commute difference for 100 employees at ₹50K average salary costs ₹25 lakhs annually in paid time spent commuting.
Most TCO models skip this because it doesn’t show up in real estate budgets. But it’s real cost. Companies moving from Cyber City to Udyog Vihar might save on rent but need to factor commute patterns for their specific employee distribution.
They use landlord estimates for utilities and maintenance. Landlords underestimate. If a landlord says “utilities run about ₹8-10 per square foot monthly,” budget ₹12. If they say “minimal maintenance required,” plan for ₹5-6 per square foot annually.
Better: ask for actual utility bills and maintenance records from current tenants. Good landlords will facilitate this. Landlords who won’t share data are hiding something.
They don’t account for lease structure differences. A traditional 9-year lease versus managed office space structures costs differently. Traditional leases have lower monthly rent but require upfront fit-out CapEx, have maintenance obligations, carry lock-in risk if you need to scale.
Managed space has higher monthly rent but zero CapEx, lower maintenance burden, flexibility to scale. You can’t compare them on rent alone—TCO analysis must factor in capital efficiency, flexibility value, and risk.
How TCO Changes Your Real Estate Decisions
When you shift from rent-per-square-foot to TCO-per-employee, different buildings start winning.
Newer buildings with efficient systems become competitive. A building at ₹120/sq ft with 30% lower utility costs, minimal maintenance, and better infrastructure might deliver lower TCO than ₹95/sq ft space that nickel-and-dimes you on operations.
ESG-certified buildings typically have 20-30% lower utility costs. That ₹15-20/sq ft rent premium often disappears in TCO analysis.
Location strategy shifts. Instead of “cheapest rent,” you optimize for “lowest employee commute cost plus rent.” For some companies, paying 20% more for better metro connectivity saves money on total cost because commute productivity impact drops.
Companies with employees concentrated in certain areas might accept higher rent for locations that reduce commute burden, knowing they’re saving on recruitment, retention, and daily productivity costs.
Build-to-suit and managed models become viable. When you only look at rent, build-to-suit and managed space seem expensive. When you factor in avoided CapEx, lower maintenance, faster occupancy (no 5-7 month fit-out delay), and operational efficiency, TCO often favors these models.
A managed office at ₹150/sq ft versus traditional lease at ₹100/sq ft plus ₹800/sq ft fit-out amortized over 5 years (₹160/sq ft effective) plus maintenance and management overhead—suddenly managed doesn’t look expensive.
Size and layout optimization changes. TCO per employee focuses attention on space efficiency. Do you need 120 sq ft per person or can you operate effectively at 90 sq ft per person with better layout and shared spaces?
If TCO is ₹15K per employee monthly and you can reduce space per employee 20% without compromising function, you just saved ₹3K per employee monthly—₹36K annually—which compounds across headcount.
Applying TCO to Your Gurgaon Office Decision
Here’s the practical playbook:
Before touring space, define your TCO target. Don’t just budget rent—budget total occupancy cost per employee. If you can afford ₹15K per employee monthly all-in, work backwards to determine what rent level supports that after utilities, operations, productivity costs.
This keeps you focused on value, not just price. A ₹95/sq ft building that runs ₹18K per employee TCO is worse than ₹120/sq ft space delivering ₹14K per employee TCO.
Request detailed operating data from landlords. Ask for:
Average monthly utility bills per square foot (last 12 months)
Maintenance expenses incurred (last 12 months)
Common area cost breakdowns
Current tenant references for operating cost validation
Don’t accept vague estimates. Get actual data or walk away.
Model commute impact for your specific team. Don’t use general assumptions. Where do your 100 employees actually live? What’s the commute time difference between buildings you’re evaluating?
For each location, calculate: (average commute difference in minutes) × (hourly salary cost) × (220 working days) × (headcount). This is real annual cost that matters as much as rent.
Factor in flexibility and scale. If you’re growing 40% year-over-year, what’s the cost of relocating in 18 months because you outgrew the space? If you’re experimenting with business models, what’s the value of being able to scale down without breaking a 9-year lease?
Flexibility has monetary value. Quantify it in your TCO model. A higher-rent flexible option that avoids ₹30 lakhs in relocation costs 2 years from now might be the better TCO choice.
Include operational failure costs. A beautiful-looking space with poor acoustics, inadequate meeting rooms, or unreliable HVAC creates costs. Lost productivity from noise, external meeting space rentals, employee frustration affecting retention—these have real financial impact.
Buildings with proven operational track records cost less to occupy even if rent is higher.
📥 RESOURCE: Download the Gurugram Office TCO Playbook 2026 for detailed TCO calculation templates, cost benchmarks by micro-market, and decision frameworks comparing traditional leases versus managed space models.

Conclusion: Optimize for Total Cost, Not Base Rent
The days of choosing office space based primarily on rent per square foot are over.
CFOs evaluating Gurgaon real estate in 2026 calculate total cost of occupation per employee per month because that’s what actually affects financial performance. Base rent matters, but it’s 40-50% of total occupancy cost.
The other 50-60%—utilities, maintenance, fit-out amortization, productivity impact—determines whether your office is a good financial decision or an expensive mistake.
Companies that optimize for TCO make better real estate choices. They spend smarter, not necessarily less. Sometimes the higher-rent option delivers lower total cost. Sometimes the premium building saves money through operational efficiency. Sometimes managed space beats traditional leases on total economics despite higher rent.
You don’t know until you calculate total cost of occupation.
For guidance on TCO analysis and office space evaluation in Gurgaon, get in touch with AIHP.